How to design a measurement using AITracker GUI?

Recordings are just video. In order for the system to count all existing objects and for the client to receive the results, the measurement point must first be configured. The minimum configuration is
- Selection of the AI detector and the counted classes of objects,
- Drawing relations or sections,
The following overview applies to the Design tab in AITracker GUI.
Multiple point configurations
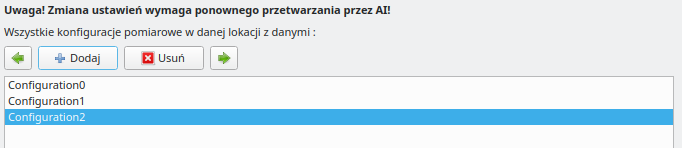
A configuration file is created for each measurement point - saved as config.json. The measurement point always has the first basic configuration (Configuration0 directory), while the user can add more configurations using the Configuration tab.
Example. The user has created two measuring point configurations. In the first, he defined the relations L and P. It will count all vehicles crossing the road. In the second configuration, he drew only one cross-section A across the pedestrian crossing and chose to count cyclists and pedestrians for the Detector. The second configuration will only count pedestrian/bicycle traffic in the cross-section of the passage.
Types of measurement point setup items
Measurement point configuration elements are divided into:
- modifiable after counting (e.g. relations, sections, classification, result sheet)
- non-modifiable after counting - changing them requires re-counting (e.g. detector and object classes, obstacles)
Detector and selection of counted classes of objects
At AISP, we use our own division of vehicles/pedestrians into categories. We call these RAW categories. Each video is always counted in accordance with the RAW categories, and then the RAW categories are converted into the classification selected by the user. This gives us flexibility.
Detector - detection accuracy
Detection accuracy affects the smallest size of detected objects. In the future, this setting will be automatic. At this point, category M is sufficient for sections, while intersections and highways require XS or XXS.
Detector - types of categories
All categories recognized by AI are:
- a.bicycles
- b.moto
- c1.passenger
- d1. vans
- truck e
- f2.truck
- g.buses
- farming
- c1A passenger trailer
- d1A.available trailer
- f1.truck.trailer
- i.horse
- pedestrian protection (off by default)
- with.trains
- r.registration (disabled by default)
- f3.truck.trailer
- d2.bus access
- d2A.supply.bus.trailer
The default setting for counted categories is correct. You probably don't need to change anything in these options and leave the default layout.
Cropping

Cropping allows you to crop and (digitally) enlarge a selected area of the movie. A better frame and larger vehicles translate directly into better recognition of objects by AI (the size of objects in the frame matters).
Obstacles in the camera frame

Obstacles are information only for the program that counts objects and must be defined before counting the movement. They allow the system to take into account situations in which an obstacle obscures an object and expect the object to emerge from the other side.
Sections

Sections are one of the main categories by which the results in the spreadsheet can be grouped. Sections are defined by drawing a section curve (it does not have to be a straight line). There is no limit to the number of sections. When no cross-section is defined, each object will be assigned to the default cross-section A covering the entire frame anyway.
The cross section can also be used to filter categories of results. Allows you to select the categories that will be counted in this cross-section (all categories by default).

Attention! When you define 1 or more sections, the result sheet includes only objects that have exceeded at least one section. Other objects will have the status Validated : False.
Areas
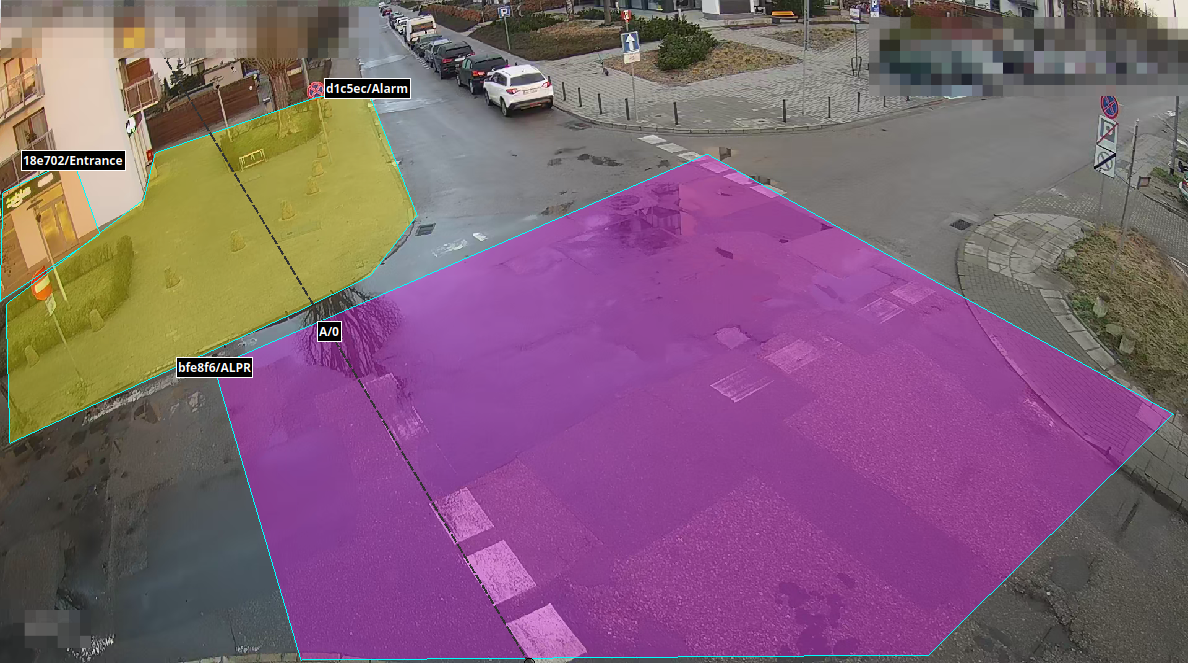
Areas allow you to define areas in the frame with specific properties. Available areas
- FilterTrackers - tracking of objects is possible only within this area,
- FilterDetections - detection of objects by AI is possible only within this area,
- ALPR - informs the system that ALPR detections from this area are the most reliable
- Parking - selects a parking zone where the time and statistics of parking can be counted,
- Alarm - an area that generates an event each time an object enters/exits the area, (work in progress)
- Entrance - area defining entrance/exit. Allows you to count incoming/outgoing objects. (work in progress)
Attention! This functionality is still under development and it is not recommended to use it!
Relations

Relations are one of the main categories by which the results in the spreadsheet can be grouped. Motion relations are defined by user-painted 'motion curves'. There is no limit to the number of defined relations.
Each curve is automatically evaluated for the direction of motion relative to the curve start point.
- straight
- left
- law
- turning around
Each relationship can be able to:
-
on - vehicles from this relation are included in the score sheet
-
off - vehicles from this relationship are not included in the results (white color of the line and vehicles)
Vehicles that are not included in the results in the spreadsheet are displayed in white with a strikethrough.
Each relation can be aggregated with another relation as long as they have the same id . In the next version, this will be expanded with buttons to connect/disconnect relations.
How are vehicles assigned to stories?
Each moving object creates its own trajectory. After the movement of the object is completed, the trajectory is compared with the trajectory of each defined relationship. The relationship with the greatest similarity is considered the object relationship. The system always assigns some relation (there is no possibility for an object without relation).
Speed/distance

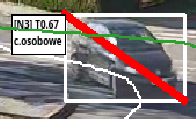
Adding a measurement section allows you to measure the speed (or travel time) in kmh/mph/ms for each object that exceeds the entire length of the section. Adding a measurement section is done by drawing two cross-section lines (red arrows in the drawing indicate two lines). The speed is determined only when both lines are crossed by the vehicle's trajectories.
When defining a new measurement section, we can select the id of the relationship for which this section will calculate the speed. You should also specify the 'distance', i.e. the real (in meters) distance of the measurement section. It is also possible to add 'speed limits' day/night. This setting applies only to the display of data in the chart and an additional column in the report on exceeding limits.

Result data
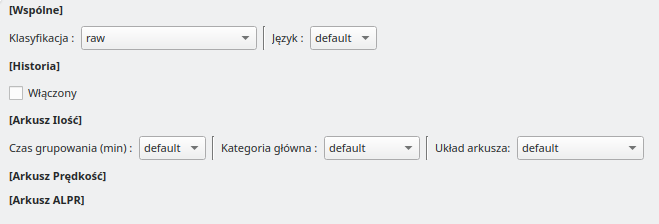
Vehicle classifications
Supported vehicle classifications are
Results grouping time
Time to group one row of the result sheet. Given in minutes. The additional file option is grouping identically to the naming/time of video files.
Main category
Main category according to which the result sheet will be sorted and created.
- Relation - relative to the relationship (e.g. L, L1, L2, P)
- CrossSection - relative to sections (e.g. A, B, C)
Sheet layout
We support several output sheet styles/layouts.
- Csv - A basic linear
Csvfile where each relation is placed sequentially,
- XlsxEntraces - Layout prepared for intersections. An
xlsxfile is created where each workbook corresponds to one entryE1, E2, E3, .... Each workbook has vertically indexed columns by both the category and the root category.
- MultiXlsxEntraces - The same layout as XlsxEntraces, with the difference that each entry workbook is a separate file.

- XlsxEntrancesHorizontal - An
xlsxfile is created where each workbook corresponds to one entryE1, E2, E3, .... Each workbook contains full tables for each relationship arranged horizontally (separator column between them).
Video properties
This tab displays the current parameters of the video. It also allows you to hardcode these values.
Example. The user's video has a frame rate of 25FPS in its header, but this is an invalid value and the actual video is 15FPS. Incorrect FPS has a negative impact on counting in the cloud as well as on the accuracy of calculating the speed of objects. To correct this, the user can define this value manually and force it on the video.
Measuring point
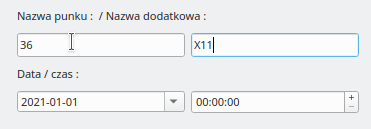
The fields related to the measurement point allow you to define the point number and subname (used in GPR) as well as the date and time of the start of traffic measurements, when these data are missing in the videos or the name of the measurement catalog.